


This report is an English language summary of a thesis authored by Ryohei Yanagi (Waseda University), Kyoji Hasegawa, Masayuki Teraguchi and Masahiko Komatsu (Nikko AM), released in the July 2024 issue of the monthly Japanese language journal Gekkan Shihon Shijou published by the Capital Markets Research Institute.
Ryohei Yanagi, Visiting Professor, Graduate School of Accountancy, Waseda University
Kyoji Hasegawa, Quantitative Analyst, Investment Technology Fund Management Department
Masayuki Teraguchi, Chief Operating Officer of Investment-Japan (COOI-Japan), Head of Investment Technology Fund Management Department and Head of Portfolio Control Department
Masahiko Komatsu, Co-head of Japan Sustainable Investment Department
Natalia Rajewska, Global Head of Sustainable Investment
Masanori Aburaki, Data Engineer, Equity Fund Management Department
Taro Egami, ESG Integration Specialist, Japan Sustainable Investment Department
Introduction
Japan’s Corporate Governance Code (CG Code), established in 2015 by the Tokyo Stock Exchange (TSE), introduced the concept that the creation of mid- to long-term corporate value are brought as a result of contributions by a range of stakeholders. The CG Code has been revised twice since, with a particular emphasis placed on the importance of addressing sustainability issues as a means to enhance corporate value.
The “Yanagi Model” provides an example of how sustainability issues have become a key part of corporate governance practices. Developed by Dr. Ryohei Yanagi of Japan's Waseda University, the model includes non-financial elements such as environmental, social and governance (ESG) factors in the financial performance measures of companies. The model aims to enhance the long-term sustainability and value creation of companies by taking these factors into account. Many managers, accounting and sustainability experts, and asset managers in Japan and beyond have come to recognise the importance of ESG initiatives for shareholder value thanks to the Yanagi Model.
We at Nikko AM collaborated with Dr. Yanagi in a yearlong project to combine academic insights with industry and empirical studies. Our analysis showed that even when the Yanagi Model was applied to a larger universe of firms in Japan with industry-specific or company-specific factors taken into account, the incorporation of ESG elements still had a positive impact on shareholder value.
An overview of the Yanagi Model
Amid the increasing importance of ESG, which could impact companies' sustainability, long-term success, reputation and so forth, the Yanagi model was created to elucidate the relevance of ESG and shareholder value. The model seeks to quantify non-financial capital from a viewpoint that ESG values are factored into a company’s price to book (P/B) ratio.
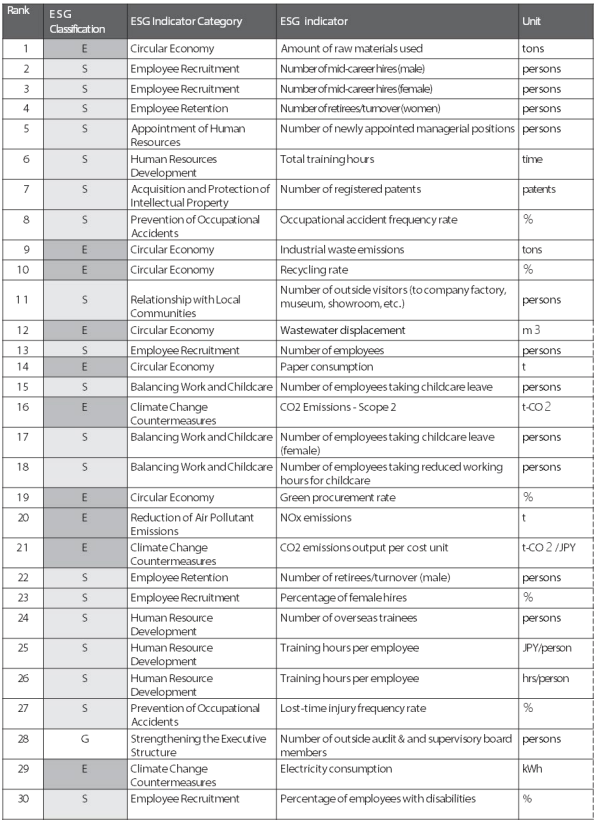
As of this writing, the following eight Japanese companies have publicly disclosed their adoption of the Yanagi Model: Eisai, KDDI, Nissin Foods Holdings, NEC, East Japan Railway Company, Asahi Group Holdings, Komatsu and Tsumura. In addition, several dozen companies have adopted the model through ABeam Consulting, a Tokyo-based consulting firm. Table 1 shows the “ABeam Top 30”, which highlights the top ESG indicators that enhance the corporate value of Japanese companies.
Table 1: Top 30 indicators that enhance Japanese companies’ corporate value
Source: ABeam Consulting Any reference to a particular security is purely for illustrative purpose only and does not constitute a recommendation to buy, sell or hold any security. Nor should it be relied upon as financial advice in any way.
Applying the Yanagi Model to all TOPIX-listed companies
Initially, disclosure examples of the Yanagi Model were limited to individual companies, such as Eisai and Nissin Foods Holdings. The need therefore arose to verify whether the model could be applied to all Japanese companies. In our study we targeted all the TOPIX-listed companies and applied a large number of ESG indicators to the Yanagi Model to analyse and consider their relationships with shareholder value.
Gist of our analysis
Our aim was to verify the relationship between 54 types of ESG key performance indicators (KPIs) and shareholder value by examining TOPIX constituent companies for multiple years. The analysis utilizes dummy variables to consider variations of price to book attributed to fiscal years as well as company-specific (or industry-specific) effects. Furthermore, since the relationship with shareholder value varies by industry from a materiality perspective, the same analysis was performed for each specific industry.
For our analysis, we utilised panel data accumulated in a time series by fiscal year (FY) from cross-section information of TOPIX-listed companies. The total amounted to 35,758 companies between FY2004-2022. Of these, we conducted regression analyses for each KPI for the companies for which data was available. The number of companies with available data varied depending on each KPI verified; the median value was 21,275 companies.
Research design
The Yanagi Model formula used to conduct the regression analysis is shown below:

Control variables utilised in the model formula: fixed effect and pooled regression models
The two types of control variables we utilised for the above formula are (1) the fixed effect model and (2) the pooled regression model. The fixed effect model incorporates fiscal year dummy terms, with P/B levels adjusted for each fiscal year in the formula; it also incorporates company dummy terms, with P/B levels adjusted for each company. The pooled regression model controls fiscal year and industry factors using 10 industry classifications based on the TSE’s 33 sectors.
ESG KPIs selected for our analysis
- Environment (17 KPIs): Indicators included measurements of environmental impacts from company activities such as greenhouse gas emissions per sales unit, total volume of waste generated, volume of water usage and total energy consumption. Others included assessments as to whether a company has a policy on addressing environmental issues, discloses relevant targets and acts to meet its targets.
- Social issues (19 KPIs): Indicators included diversity (percentages of female employees, percentages of female directors, percentages of employees with disabilities), human capital (implementation of employee engagement, training hours per employee), human rights (efforts to maintain human rights, measures to prevent child labour).
- Governance (18 KPIs) Indicators included ratios of independent directors, the size of the board of directors, and the existence of ethical guidelines (such as corporate ethics and a bribery prevention policy, assuming a positive relationship with shareholder value).
Analysis results
Results for all TOPIX-listed companies
Our analysis results for all TOPIX-listed companies are shown in Table 2, which indicates the percentage of KPIs with statistical significance and the desirable sign of the coefficient in the above regression analysis.
Table 2: Percentage of signs obtained that are consistent with the hypothesis in the universe of all TOPIX constituents (significance level 5%: p-value less than 0.05)
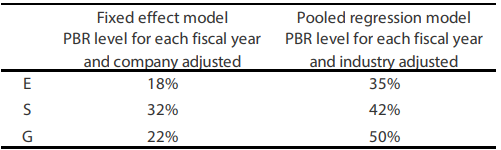
Table 2 indicates that 35-50% of the ESG indicators showed a statistically significant relationship with shareholder value in the pooled regression model. In contrast, fewer ESG KPIs indicate the relationship in the fixed effect model. This is because compared to the pooled regression model, the fixed effect model is affected by company attributes that are fixed over an extended period of time. For example, we found that the estimated coefficient signs for a specific KPI (e.g. Scope 1+2 greenhouse gas intensity) were different in the two models. The pooled regression model had a coefficient estimate that was consistent with the expected sign based on the hypothesis, while the fixed effect model did not.
For social (S) indicators, a strong significance was observed in KPIs related to factors such as the ratio of female executives and directors. The results suggest that improvement in the ratio of women with positions close to company decision-making had a strong relationship with shareholder value. In 2023, the government’s female empowerment and gender equality plan contained a proposal for setting numerical targets for ratios of female directors at companies listed on the Tokyo Stock Exchange’s Prime Market. This appears to have created a supportive relationship. The governance (G) indicators showed that a significant percentage of companies were not doing enough to rectify their situation even though they were failing to generate enough profits to meet the cost of their shareholder’s equity. This highlights an area that companies and investors need to focus on for better engagement.
Results by industry
Our analysis results by industry are shown in Table 3, which also lists the ratios of statistically significant and desirable correlations between ESG indicators and shareholder value.
Table 3: Percentage of signs obtained that are consistent with the hypothesis by sector (significance level 5%: p-value less than 0.05)
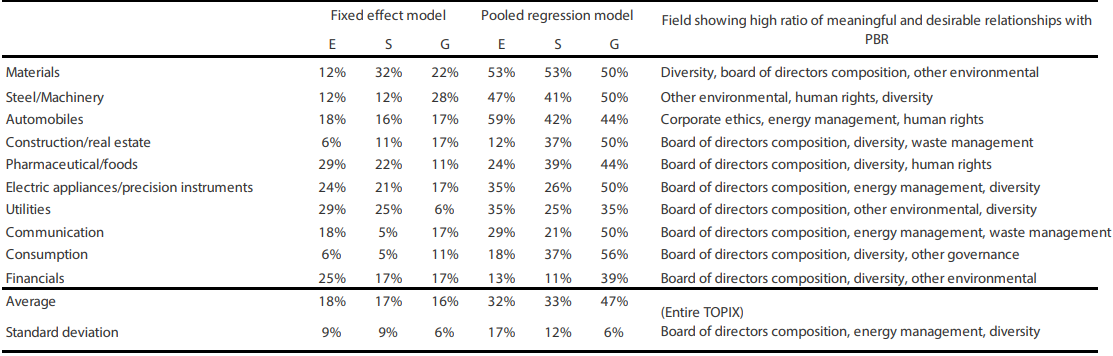
As with our all-TOPIX analysis, the pooled regression model showed higher ratios of statistically significant relationships between ESG indicators and shareholders’ value compared to the fixed effects model. There was more variation in environmental (E) and social (S) indicators relative to governance (G) indicators, especially with the pooled regression model; for example, more KPIs with statistical significance were found in materials, steel/machinery and automobiles for environmental indicators compared to other industries like consumer goods and construction & real estate.
We also found that there are industry-specific factors that affect the materiality of sustainability information. For example, environmental-related initiatives such as climate change and waste management can have a greater impact on shareholder value in some industries (such as materials, steel/machinery and automobiles) than in others (such as consumption and constructioneal estate). Similarly, the relationship between diversity and shareholder value can vary depending on the industry and other attributes. Overall, the materiality of sustainability information may have more pronounced industry-specific attributes for environment and social-related factors than for governance-related factors.
Summary
Our approach considered industry or company-specific factors and utilised data from all TOPIX-listed companies. The results unequivocally demonstrate the positive relationship between some ESG initiatives and shareholder value, providing a solid foundation for confidence and conviction in the Yanagi Model.
Our analysis found that some ESG KPIs had a statistically significant and desirable relationship with shareholder value. For some of those indicators, the same results were confirmed in the previous research introduced in Table 1, i.e., the "ABeam Top 30". This consistency has important implications for corporate managers, accounting and sustainability experts, portfolio managers and others. On the other hand, we also found that efforts related to human capital and human rights, such as measures to prevent child labour, take time to be reflected in shareholder value. As such, persistent efforts are essential in this area.
We hope that our empirical research results will encourage dialogue between companies and investors regarding sustainable improvement of shareholder value. As ESG efforts continue to progress on the corporate side, we expect this to enhance shareholder value for many Japanese companies. This is in line with the recommendations of the Japan Exchange Group.
Our comprehensive analysis of the Yanagi Model across TOPIX-listed companies highlights a critical finding: ESG integration can drive value when applied in a focused manner through the materiality lens. The significant correlations found, especially in social and governance factors, require our attention. The data speaks volumes, in our view. Integrating ESG factors is not optional; it is essential for long-term value creation.