


The yen has remained undervalued by several measures despite normalisation by the Bank of Japan (BOJ), above-target inflation and narrowing US-Japan yield differentials. The role of yen-funded carry in supporting long-duration risk assets suggests that the currency may remain undervalued until risk appetite, global liquidity conditions or Japanese capital flows begin to shift.
The puzzle: why has the yen remained weak?
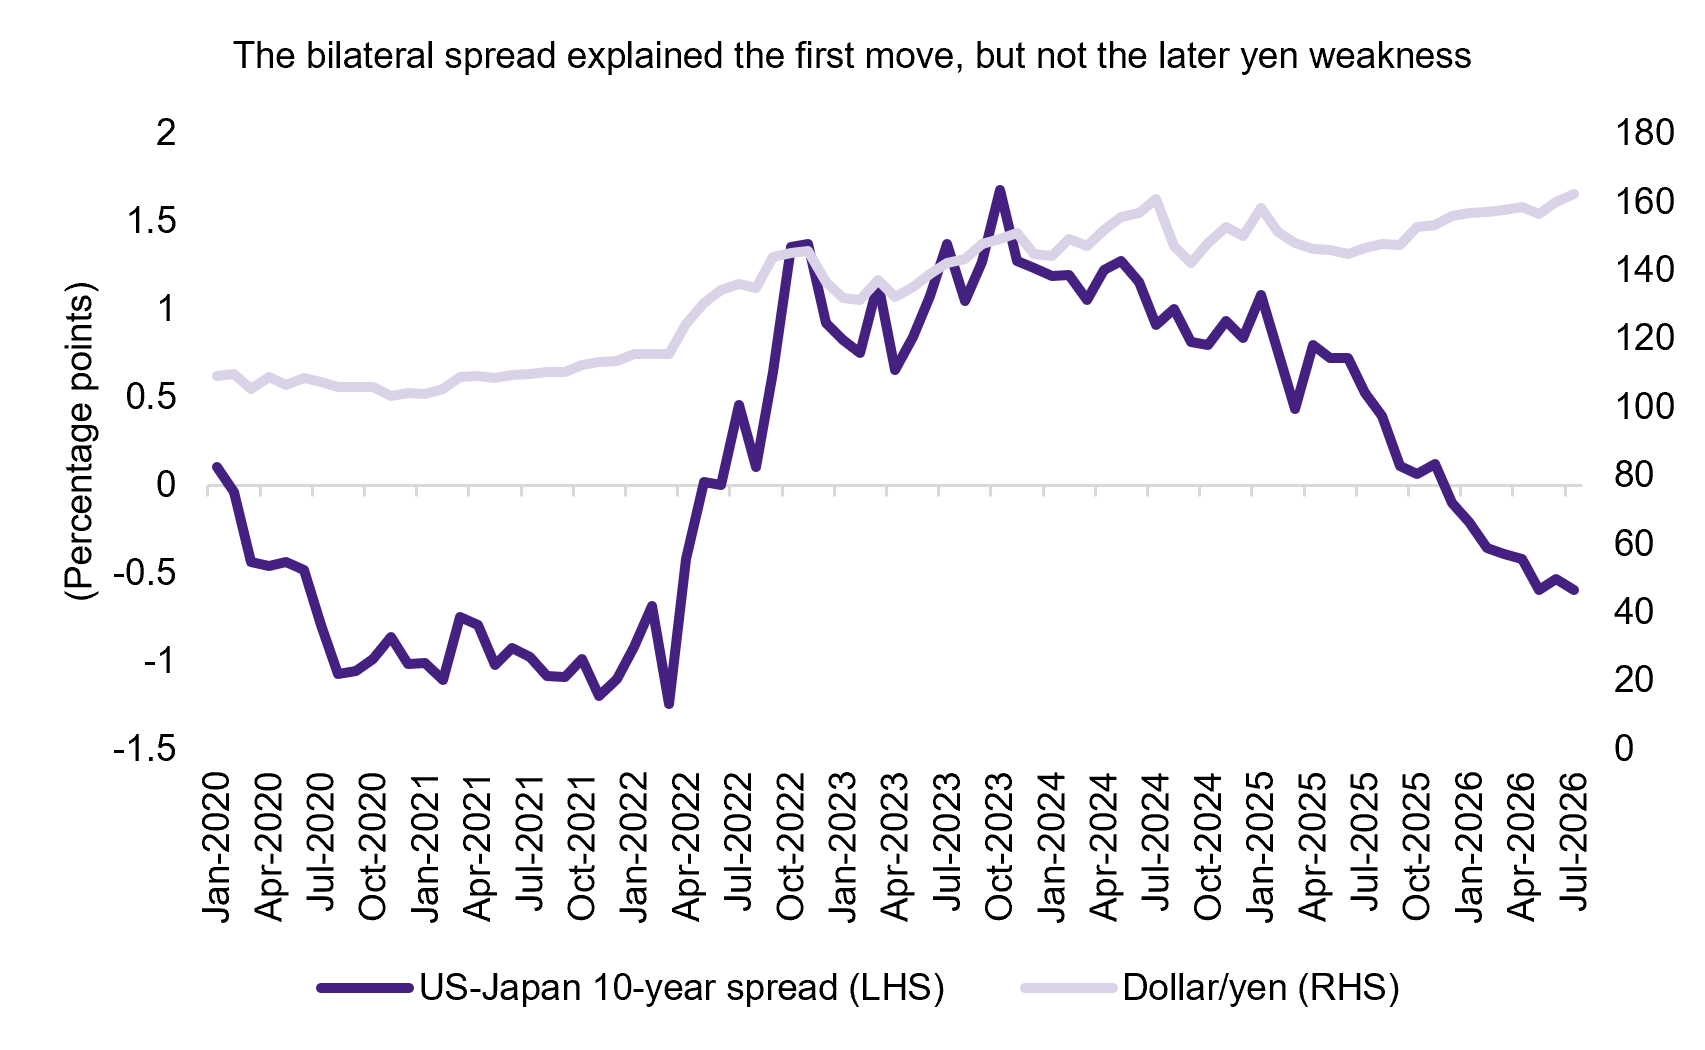
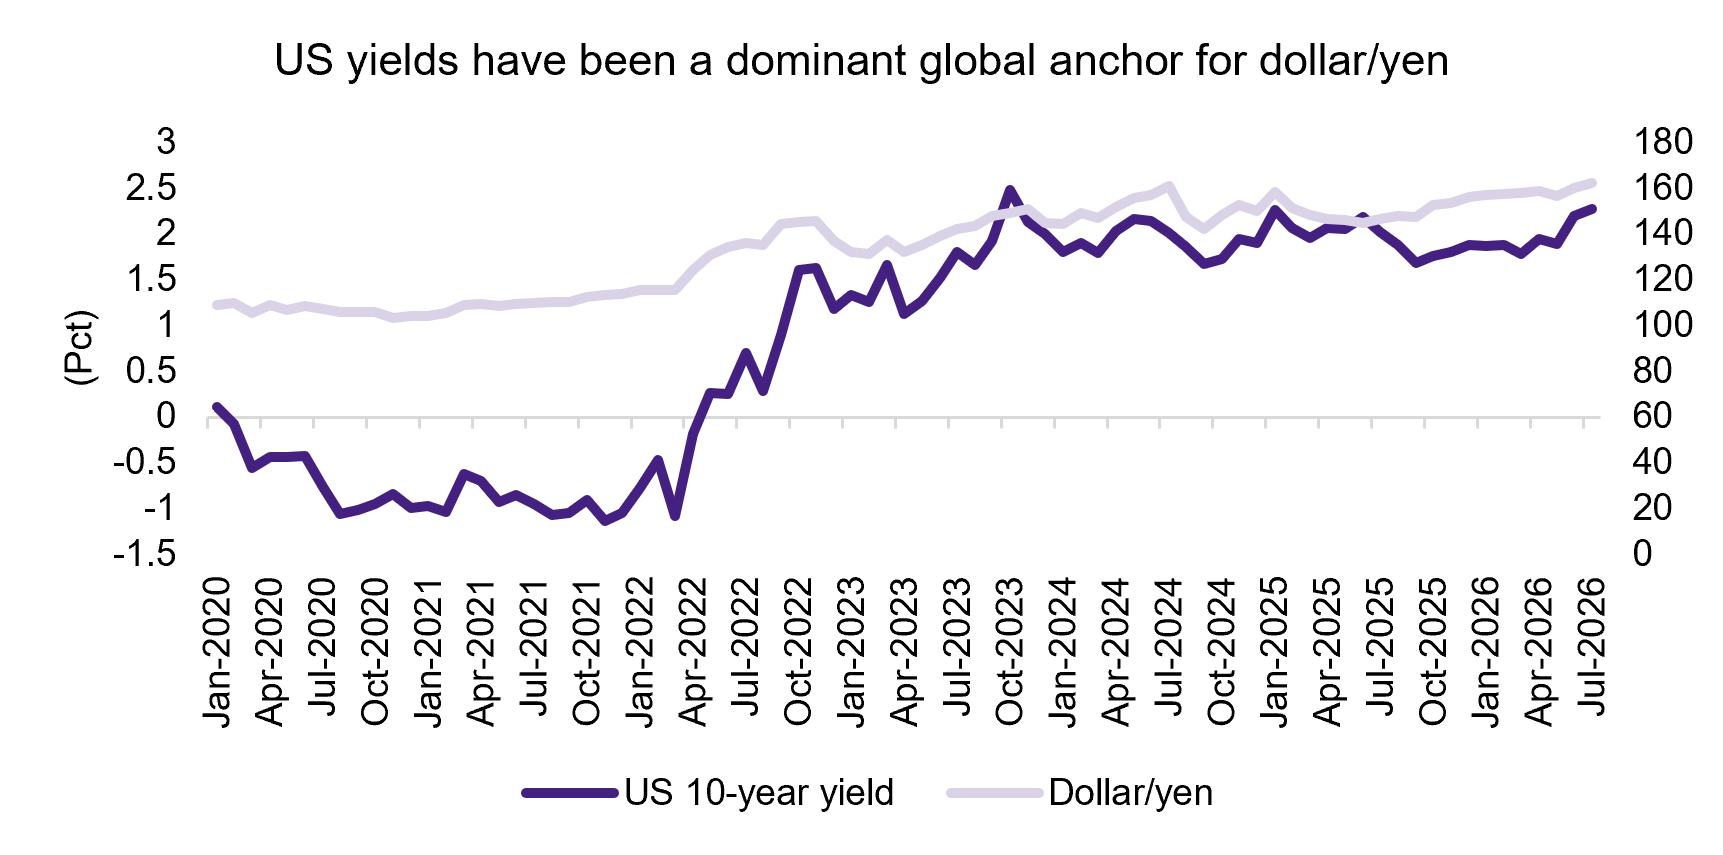
Since March 2024, the BOJ has continued to gradually normalise policy, while Japan’s headline inflation—as well as core inflation excluding volatile and government-subsidized items—has remained above the bank’s 2% inflation target. Nominal wage growth has remained positive, with real wage growth recently following suit. Meanwhile, the yen remains cheap across a range of valuation metrics, with the currency having failed to appreciate despite reflationary signals and the narrowing US-Japan yield differential. In fact, dollar/yen appears to have become desensitised to the 10-year yield differential (see Chart 1) and has instead been moving in line with the US long-term yield (see Chart 2).
Chart 1: Decoupling of dollar/yen from the US-Japan 10-year yield spread
Source: Bloomberg
Chart 2: Dollar/yen and the US 10-year yield
Source: Bloomberg
This development is related to, though not the same phenomenon as, our earlier observation that yen carry (the use of low-cost yen borrowing to fund investments elsewhere) has tended to be drawn less to overseas bonds and more to a small group of high-capitalisation, long-duration risk assets, which have so far benefited most from the ongoing technology investment boom.
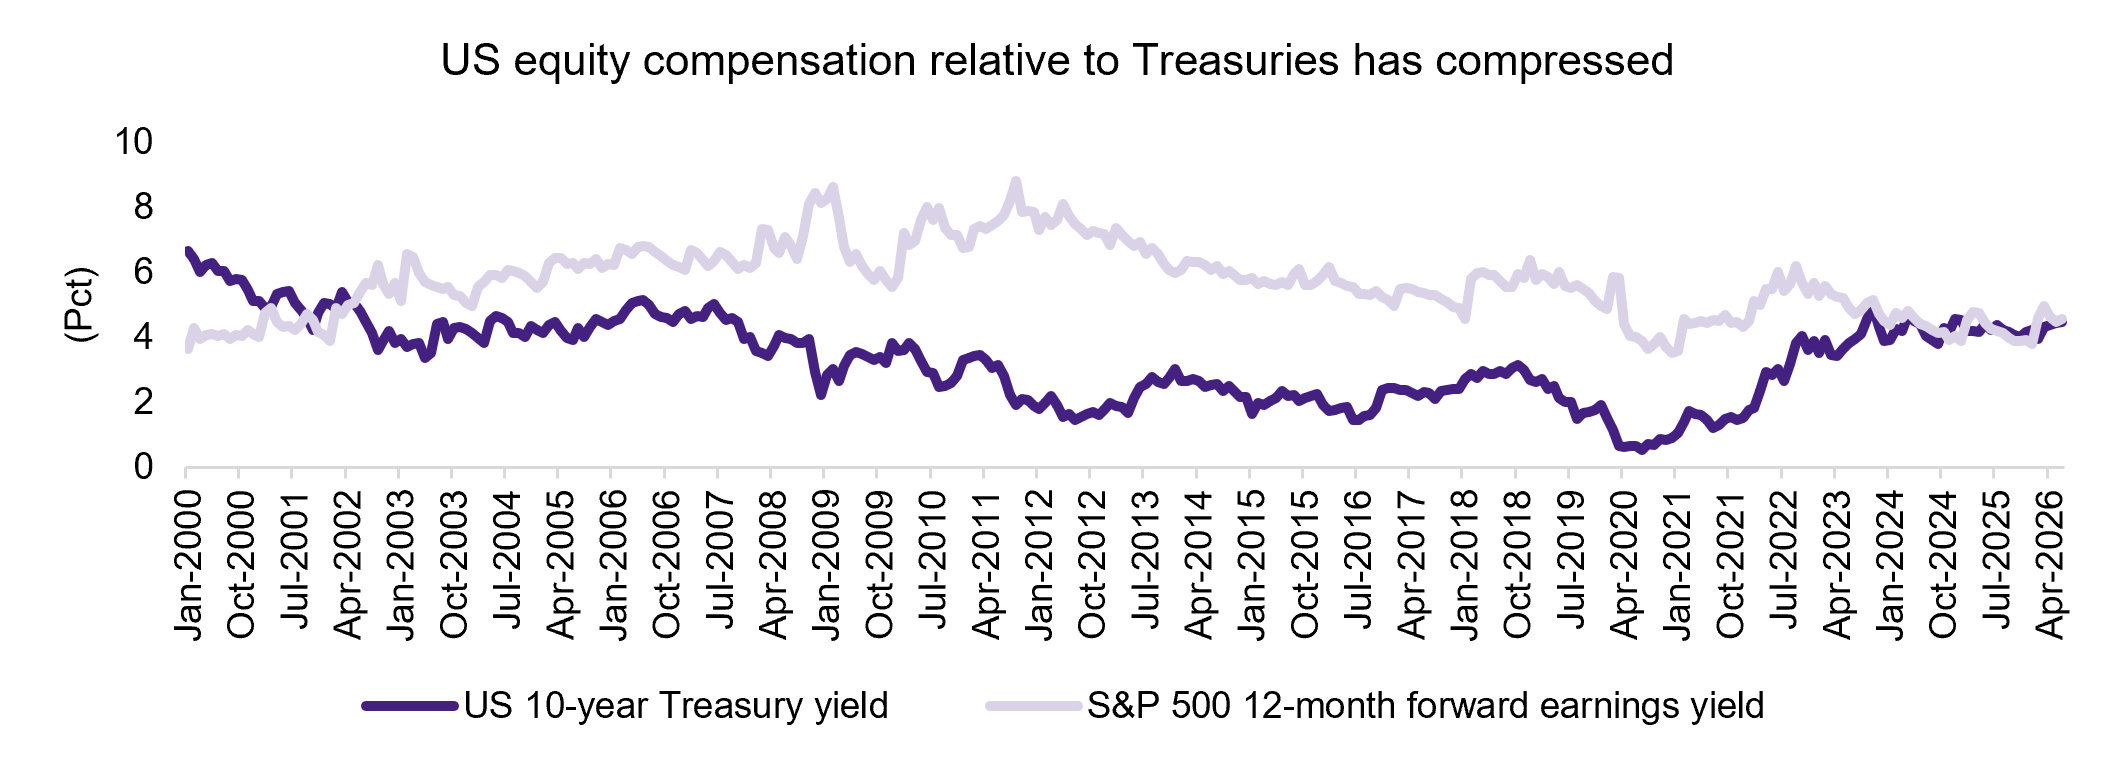
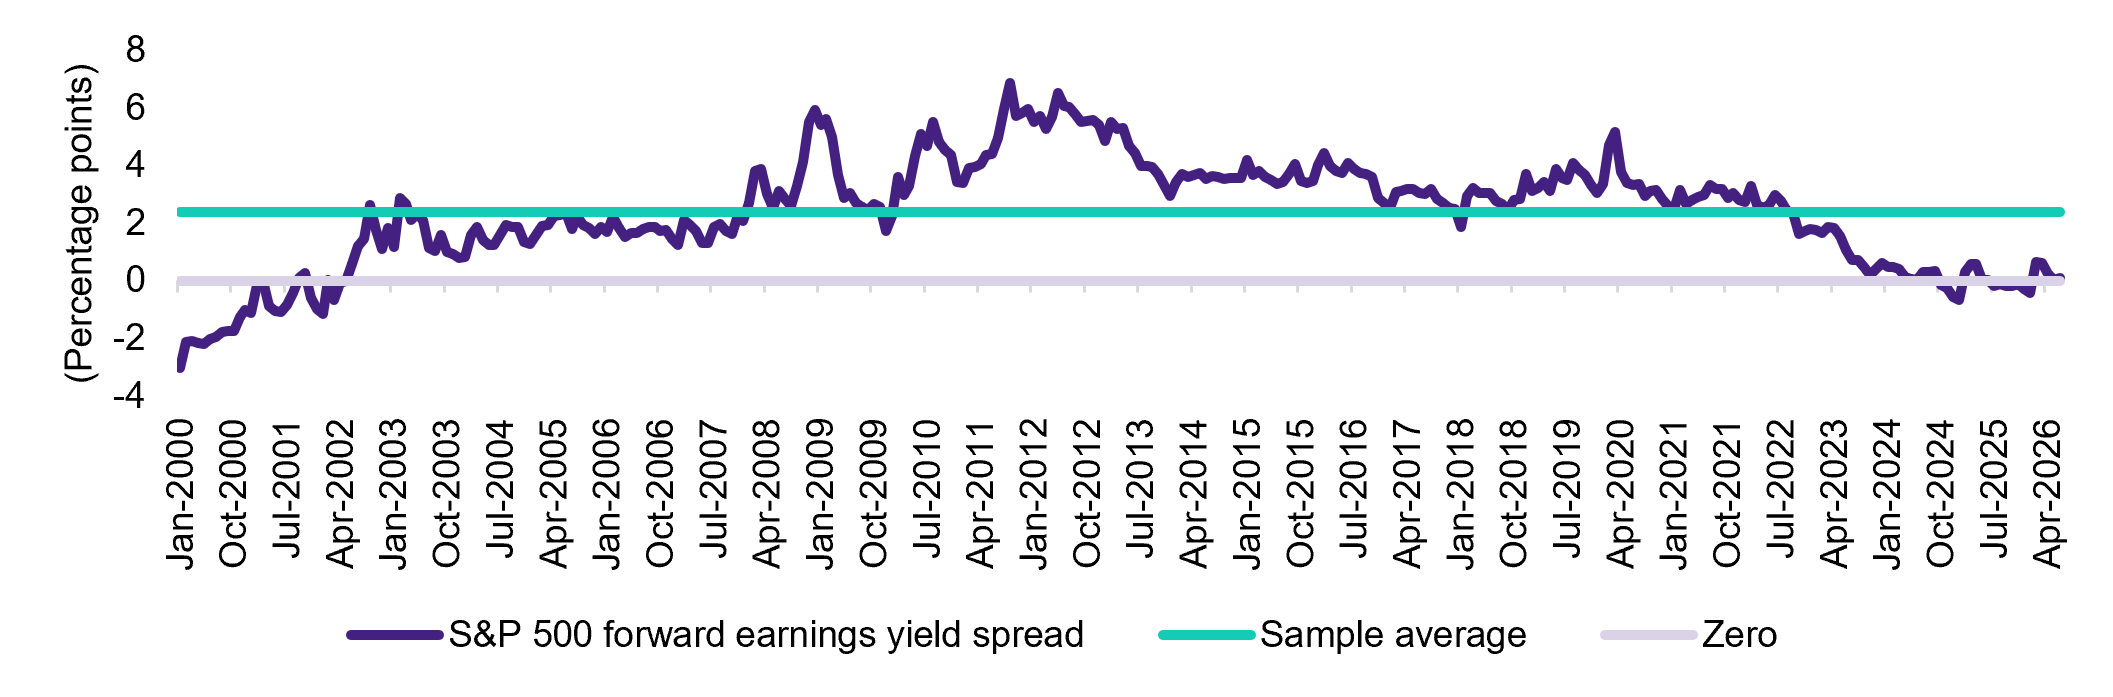
The connection between these two trends lies in the US market. Based on the 12-month forward earnings yield for the S&P 500, US equities no longer appear to provide a sufficient risk premium to offset the rising cost of long-term funding (as proxied by the 10-year Treasury yield; see Chart 3). However, as we explain below, funding investments in yen helps to keep the risk premium more positive, even if it does not make it especially attractive.
Chart 3: Compression in US equity compensation relative to Treasuries
Source: Bloomberg
Traditional explanation incomplete: this time, carry is flowing into long-duration assets
Recent history shows that dollar/yen yield differentials have clearly mattered in the past, and it is likely that they still have some influence at the margin. However, they do not fully explain market behaviour.
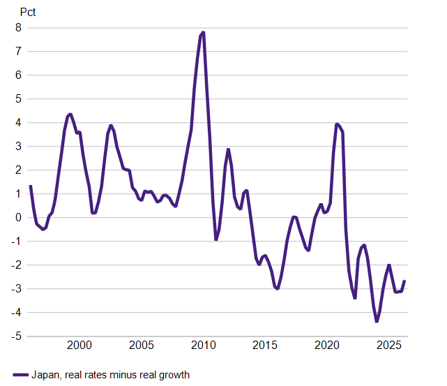
Instead, more importantly to the current, narrowly based carry trade, financial conditions remain highly accommodative across markets, especially in Japan, where interest rates continue to lag real growth (see Chart 4). Although this is positive for Japan’s economy, the absence of capital controls restricting flows in and out of the country means that it can also benefit investors in long-term duration risk assets, as they are able to borrow in yen. In our view, this is the key feature of the current market regime that best explains the ongoing pressure on the yen, given that relative fundamentals alone cannot account for the currency’s present weakness.
Chart 4: Japan - real interest rates and real GDP growth
Source: Amova Asset Management, BOJ, data as of May 2026
Why higher-for-longer has not yet disrupted the carry regime
As we have pointed out before, some central banks are shifting their focus from supporting growth to containing inflation, while markets in some economies, including the US, are pricing in higher-for-longer interest rate regimes. Over time, this may become less favourable for risk assets as liquidity is withdrawn and rising discount rates reduce the present value of future earnings. However, monetary policy is a blunt tool, and its effects tend to appear with a lag, sometimes of several quarters. For now, markets have not fully reflected these expectations through a materially higher hurdle rate (or required return) for risk assets. This makes the flow from yen funding into US risk assets somewhat rational although the resulting risk-adjusted return is not especially compelling. At present, the “duration funded by carry” regime remains intact.
The challenges facing the BOJ: not as simple as being “behind the curve”
Some investors argue that the yen’s weakness can be explained simply by the BOJ being “behind the curve”. However, before criticising the BOJ for allowing inflation to move beyond the reach of short-term interest rates, two points are worth recalling. First, as discussed above, relative rate expectations alone are currently not enough to explain the yen’s weakness against the dollar. Second, although Japanese government bond (JGB) yields have been less useful than US yields in explaining recent yen moves, the rise in longer-end JGB yields is still worth examining for what it tells us about the market’s view of Japan.
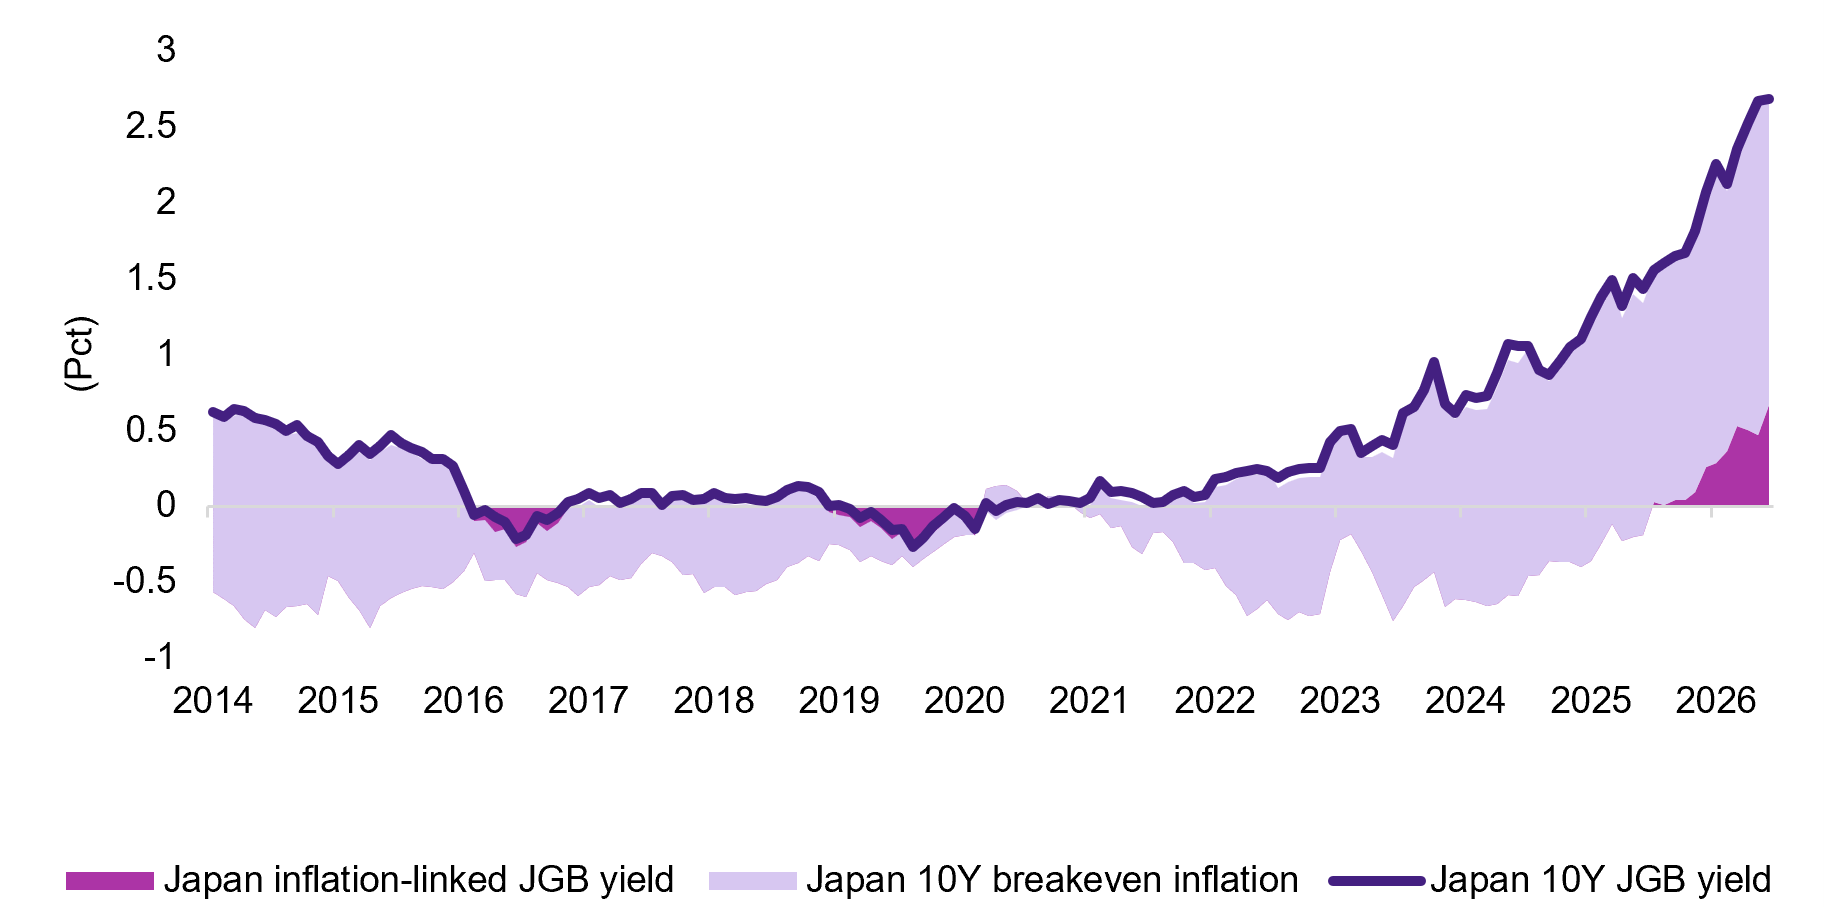
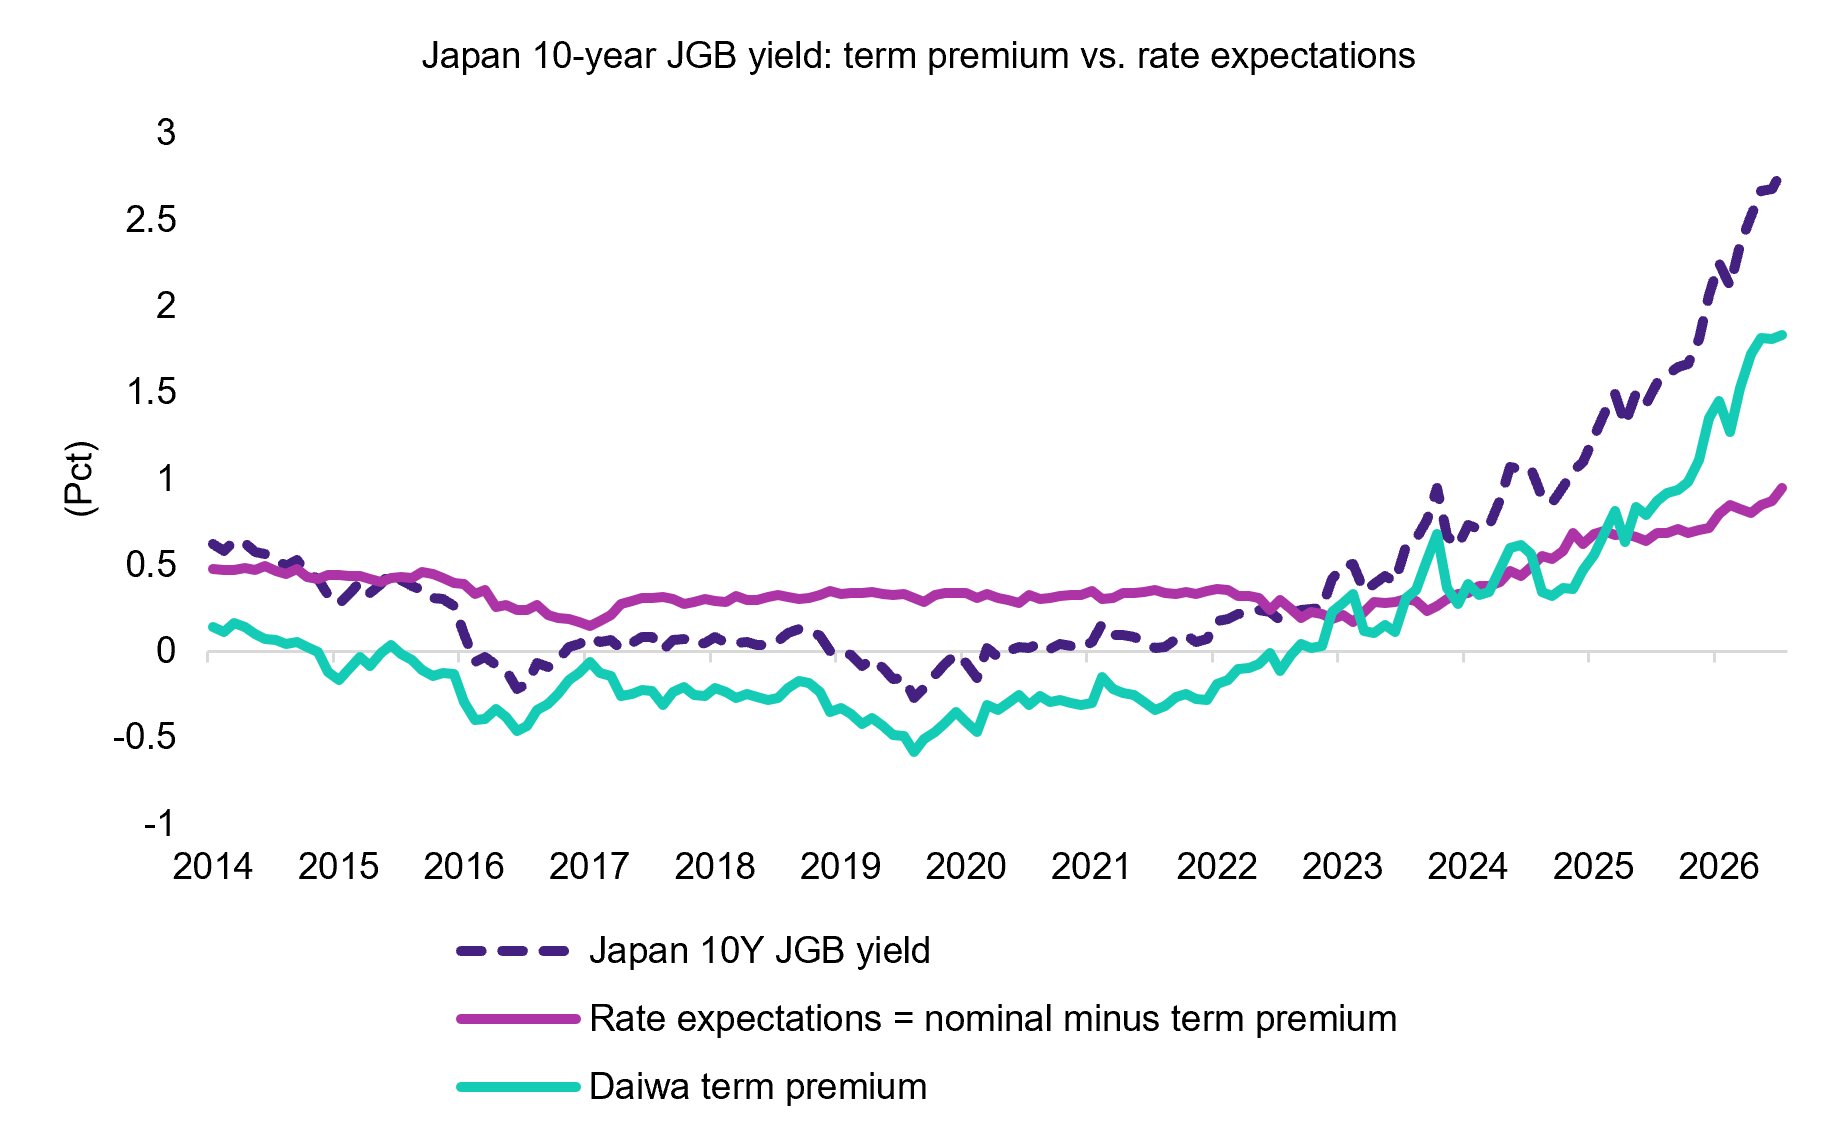
Charts 5 and 6 provide two different breakdowns of the 10-year JGB yield. Chart 5 shows that implied inflation expectations, measured using JGB break-even inflation rates, have risen and account for much of the increase in the 10-year yield. By contrast, real yields have moved less. Chart 6 examines the yield from another perspective, separating the term premium from risk-neutral rates. This shows that the term premium in JGB yields has been rising, possibly reflecting fiscal credibility concerns rather than a universal market view that the BOJ is behind the curve. By comparison, a decomposition of the US Treasury curve using a similar methodology to that in Chart 5 shows both rising inflation expectations and higher real yields, alongside a small but positive term premium relative to that for JGBs in Chart 6. These developments suggest that markets expect the Federal Reserve to keep rates higher for longer.
Chart 5: Japan 10-year JGB yield decomposition
Source: Amova AM, Bloomberg
Chart 6: Japan 10-year JGB yield—term premium vs. rate expectations
Source: Amova AM, Bloomberg
Taken together, these indicators support our view that markets still perceive a relative opportunity in the gap between low-cost yen funding and the fading, but still present, yield advantage offered by US financial markets.
Terms of trade tension and the BOJ’s normalisation challenge
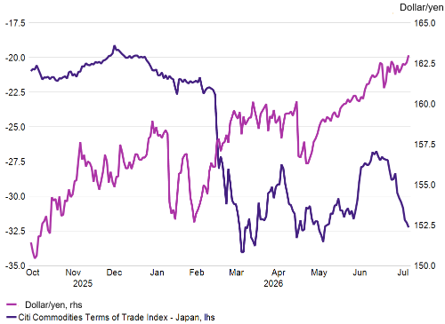
This is not to say that higher energy import prices, compounded by yen weakness, are unimportant. The deterioration in Japan’s terms of trade is measurable (see Chart 7), and is one reason the BOJ has recently signalled it is paying closer attention to the yen’s role in shaping consumer inflation expectations. However, while this gives the BOJ a reason to continue normalising rates, it is unlikely to prompt emergency rate hikes, as the BOJ’s target is underlying inflation rather than the exchange rate itself. It is also worth noting that the yen is only partly responding to the BOJ’s monetary policy stance, with other drivers lying outside the central bank’s control. That said, further yen weakness could still prompt the BOJ to adopt more hawkish rhetoric or accelerate the pace of normalisation.
Chart 7: Deterioration in terms of trade
Source: Amova AM, Macrobond
What would actually strengthen the yen?
As the Global Investment Strategy Committee indicated in its Q3 Outlook, in the absence of near-term catalysts for a global shift to a less risk-tolerant regime with higher hurdle rates (that is, higher required returns), we expect the yen-funded carry regime to continue. This implies that the yen is likely to remain weak in the near term, alongside continued strength in risk assets. However, we remain on high alert for signals that the regime is breaking down. Potential catalysts for an eventual reversal in the regime include:
Variables related to the “duration funded by carry” regime:
- A genuine deterioration in risk asset returns or confidence
- A reduction in risk appetite
Policy variables
- A material increase in perceived BOJ hawkishness relative to current market expectations
- Tighter global financial conditions (which central banks are signalling)
- Greater renminbi appreciation and ramifications for dollar assets
Real flows
- Increased repatriation of foreign assets by Japanese corporates and institutional investors
Japanese investors: early signs of flow adjustments
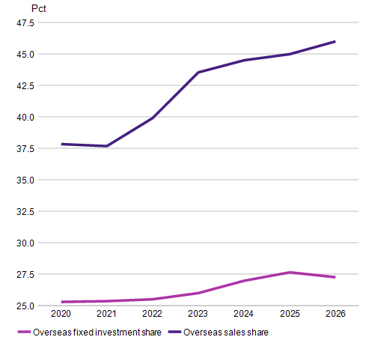
On the final point mentioned above, we have reiterated in prior publications that Japan’s sizeable current account surplus is driven not by trade, but by primary investment income. Roughly half of that income is attributable to portfolio investments, much of which may have been reinvested abroad (based on portfolio flow data to date). Direct investment income may also have been reinvested abroad, supported by the healthy growth in overseas sales reported by large Japanese companies in the BOJ Tankan sentiment survey, as shown in Chart 8. However, recent Tankan data also suggest that investment intentions may be shifting, with overseas intentions growing more slowly than their domestic equivalents, signalling a possible turn towards domestic investments. If this marks the start of a trend, it may indicate that the yen is now sufficiently weak, and domestic growth prospects sufficiently solid, to encourage a reallocation from reinvestment overseas to new investment onshore. Although this alone is unlikely to reverse the “duration funded by carry” regime, it is an important real-economy indicator that is worth monitoring.
Chart 8: Japanese firms' overseas sales and investment shares, June 2026 (%)
Source: Amova AM, BOJ, Macrobond