


Introduction
Financial markets initially treated the escalation of the Iran conflict as a conventional oil-price shock. While crude prices have since retreated from their peaks, stress signals from physical markets—particularly shipping, insurance and logistics —suggest that the underlying shock may be more persistent and more complex than headline oil prices imply.
For Japan, the key risk is not simply higher oil prices, but a deterioration in terms of trade driven by the costs of imported energy and logistics, compounded by yen weakness and constrained monetary policy flexibility. Markets—especially foreign exchange—may be underestimating the probability of these pressures forcing a more difficult policy trade-off for the Bank of Japan (BOJ).
Part 1: Why the markets may still be underpricing the risks
Markets’ initial reaction: from disbelief to a familiar oil-shock narrative
When the US and Israel launched strikes against Iran on 28 February, there was a disconnect between the physical markets (notably crude oil, which rose immediately after the strikes) and financial markets. While the bond and equity markets did react, they seemed to have initially priced in a limited conflict as we pointed out in Escalation in Iran encounters market disbelief.
As the conflict escalated, the financial markets became more responsive to the protracted strain in the physical markets. When shipping through the Strait of Hormuz was threatened, the markets eventually priced a classic energy shock scenario. Given that roughly 20% of global oil passes through this key chokepoint, crude oil prices briefly spiked to nearly US dollar (USD) 120 per barrel. Investors warned of higher inflation, delayed interest rate cuts and stagflation risks.
Oil prices alone may be an insufficient signal
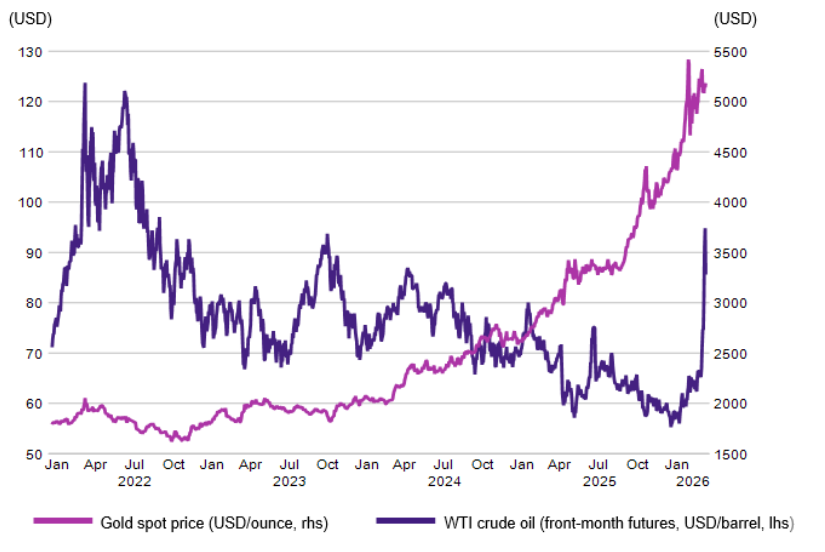
After remarks on 10 March by US President Donald Trump suggesting the conflict could end soon led to reports that oil supplies might stabilise, crude prices retraced sharply toward USD 90 per barrel. Markets appeared to downgrade the probability of the worst-case energy shock, using oil prices as the primary signal. Crude prices could continue gyrating on headlines, and this pattern—in which prices signal shifts in sentiment—may be repeated as the conflict unfolds.
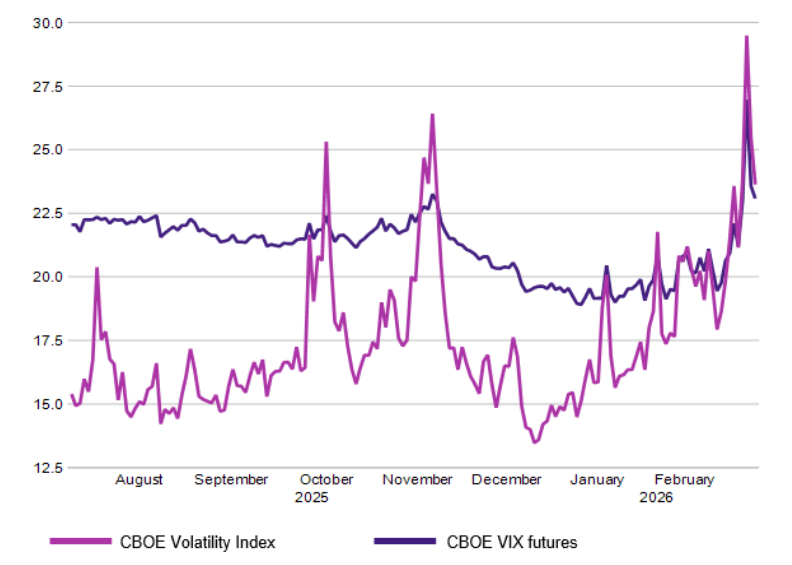
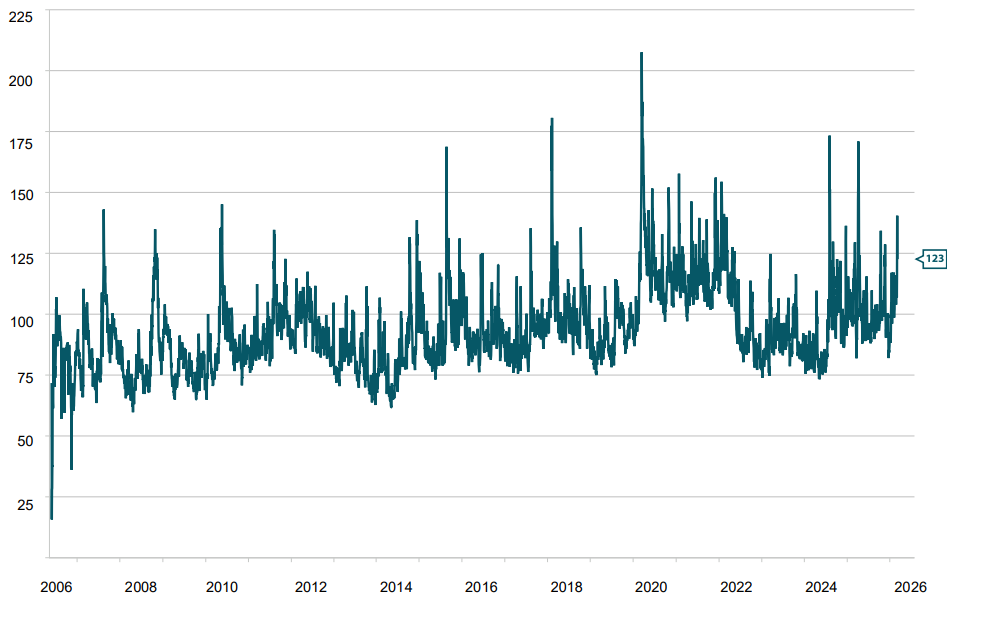
For now, several indicators suggest underlying stress has not fully dissipated, as shown in Charts 1–3.
Chart 1: Gold prices remain near record highs although oil has fallen from its recent peak
Source: Amova Asset Management, Bloomberg
Chart 2: The VIX has retreated from its peak but remains in backwardation
Source: Amova Asset Management, Bloomberg
Chart 3: Volatility-of-volatility (VVIX) remains elevated, consistent with a higher uncertainty regime
Source: Amova Asset Management, Bloomberg
What markets may be missing: persistent shock channels
Volatility risks may not reset to zero
Even if the conflict de-escalates, inflation and volatility risks may not automatically reset to zero. The following three channels may keep pressure elevated:
Energy risk premium: Temporary disruptions can permanently raise perceived supply risk. Energy risk premia tend to normalise slowly, even after physical supply resumes.
Policy volatility as a supply shock: The US policy environment is one of high unpredictability, which introduces non-linear policy shocks. As we pointed out before, policy uncertainty may be its own type of supply shock, and may be inflationary in its own right.
Supply chain fragility: A temporary disruption can still create persistent inflation pressure through shipping delays, inventory shortages, pricing power, and sticky inflation expectations. These were also observed in the 1973 oil shock and the more recent 2021 supply chain crisis. In 2021, supply disruptions initially judged as “transitory” ultimately forced the Federal Reserve (Fed) to tighten monetary policy aggressively; US inflation remains above the Fed’s target.
If markets believed the risk of a persistent shock had dissipated, volatility indicators should have normalised—with VVIX compressing, oil option skews flattening and the VIX term structure steepening. However, VVIX remains elevated. According to Bloomberg data, it has been in a higher volatility regime since mid‑2024.
Physical markets tell a more concerning story
The most acute stress has emerged not in crude prices, but in logistics and transport markets. Key indicators of a logistics shock include the following:
Insurance withdrawal: War-risk cover has been cancelled or sharply repriced, forcing reliance on government backstops as commercial markets were less willing to underwrite transit risk. This raises the risk of a systemic break in underwriting capacity.
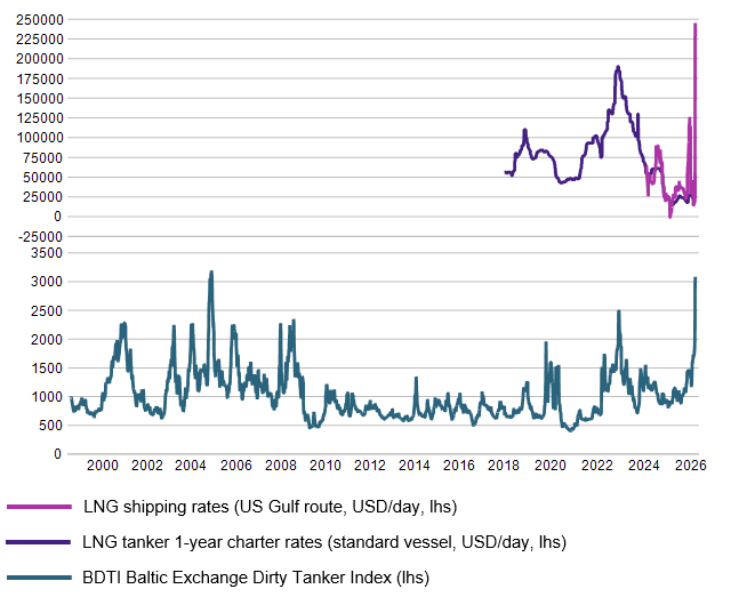
Shipping cost spikes: (see Chart 4) LNG freight rates surged from roughly USD 23k/day pre-conflict to above USD 220k/day; this is roughly a 1000% increase and a real cost borne by transporters and ultimately consumers. According to some estimates, Baltic Exchange Dirty Tanker Index (BIDY) tanker rates rose 54% in a week; again this is a real cost that freight transporters have to bear.
Collapse in physical traffic: Strait of Hormuz shipping traffic has reportedly fallen from around 130–240 vessels per day to just a handful, amounting to a functional blockade of commercial flows.
Interpretation: Additional oil supply may exist physically, but if it cannot be shipped or insured, supply cannot clear globally. The shock increasingly resembles a logistics-driven energy shock rather than a simple production shortfall.
Chart 4: LNG freight, BIDY tanker rates have surged
Source: Amova Asset Management, Bloomberg
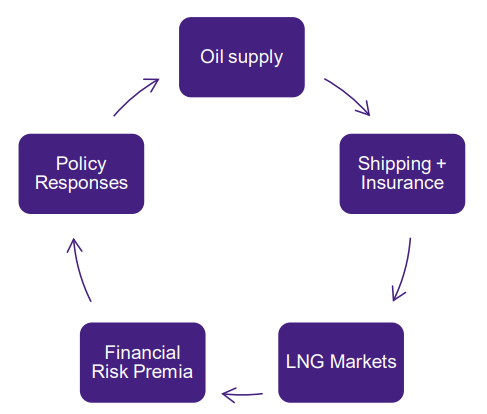
Markets have yet to integrate the “energy shock transmission loop”, illustrated below, of which oil supply is only one component.
Exhibit 1: Energy shock transmission loop
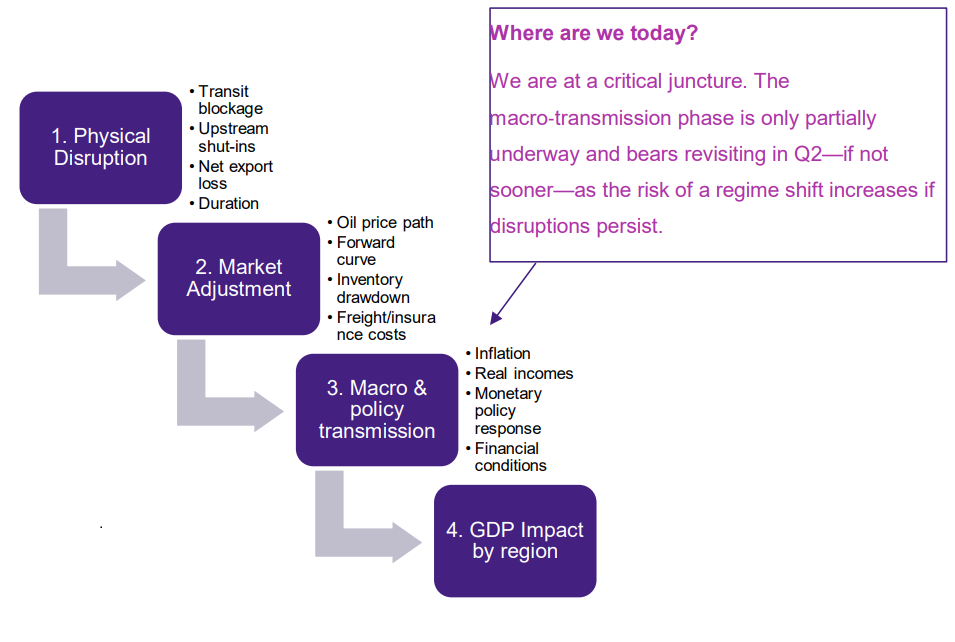
How can this play out in terms of interruptions and risks to economic output? Estimating economic damage is not as simple as “X barrels disrupted equals Y GDP lost”. Instead, the shock unfolds through stages. We conceptualise this via a “regime transition ladder” illustrated below, which maps a path to lower-GDP regimes. Currently, we may be only at the very beginning of Step 3 (macro & policy transmission), a process that could play out over the next several quarters rather than days or weeks.
Exhibit 2: Regime transition ladder
Part 2: Implications specific to Japan
In Part 1, we have evaluated the triggers of the ongoing global shock, its development and the dynamic signals surrounding it. We now emphasise the global and exogenous nature of the shock as a source of Japan-specific implications, rather than domestically generated weakness.
Could an energy shock cause recession in Japan? We cannot rule it out. That said, the country’s vulnerability to external energy shocks is not a simple "oil above X dollars equals recession" story. To illustrate, using recent data, Japan’s mineral fuel imports amount to roughly Japanese yen (JPY) 22 trillion, against economic output of around JPY 663 trillion over the past four quarters. This implies a roughly-estimated mineral fuel burden of approximately 3.3% of GDP. Of course, this figure encompasses not only crude oil— it also includes petroleum products and LPG.
Now, if we were to assume very simply that the mineral fuel complex were to rise to X% of GDP, the mineral fuel burden would amount to X minus 3.3%. However, such an estimation also means assuming that key variables (including energy volumes, exchange rates and GDP) remain unchanged. In a dynamic situation, such an assumption may be unrealistic. For example, volumes typically respond to prices, and this is only one of many moving variables.
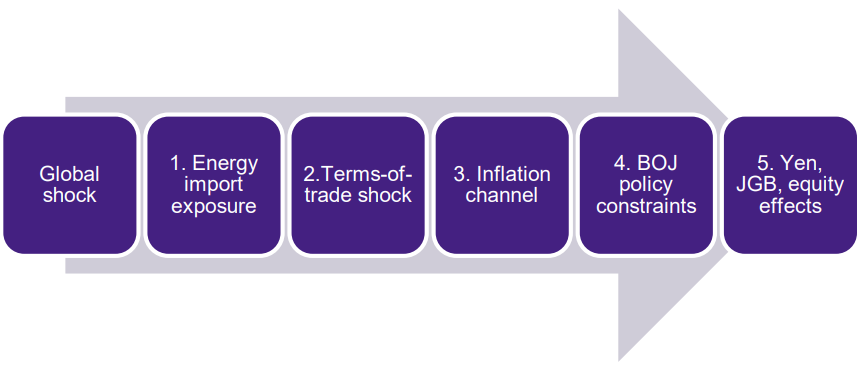
Japan’s vulnerability is thus better understood as a sequenced transmission process, in which each stage is contingent on the last. Instead of focusing just on oil prices, the risk may be better framed as a terms-of-trade and input-cost burden story, jointly shaped by energy prices, the yen and the potential for spillovers—as well as potential offsets.
We begin with the catalyst of a global energy price shock and trace its transmission through the Japanese economy, as depicted in the diagram below with each sequence explained in detail.
Exhibit 3: Japan’s vulnerability shown in sequence
Energy import exposure: a known quantity
Japan is, without question, exposed to global shocks, and especially to external energy shocks. The 2011 Fukushima disaster was a genuine structural break. Japan went from sourcing about 30% of its electricity from nuclear power prior to 2011 to a much heavier reliance on fossil fuels, and its trade surplus turned to deficits for several years. Fukushima was one of the most significant energy shocks in recent history, alongside the energy shock stemming from the war in Ukraine. According to Japan’s Agency for Natural Resources and Energy, Japan depends on the Middle East for over 90% of its crude oil imports.
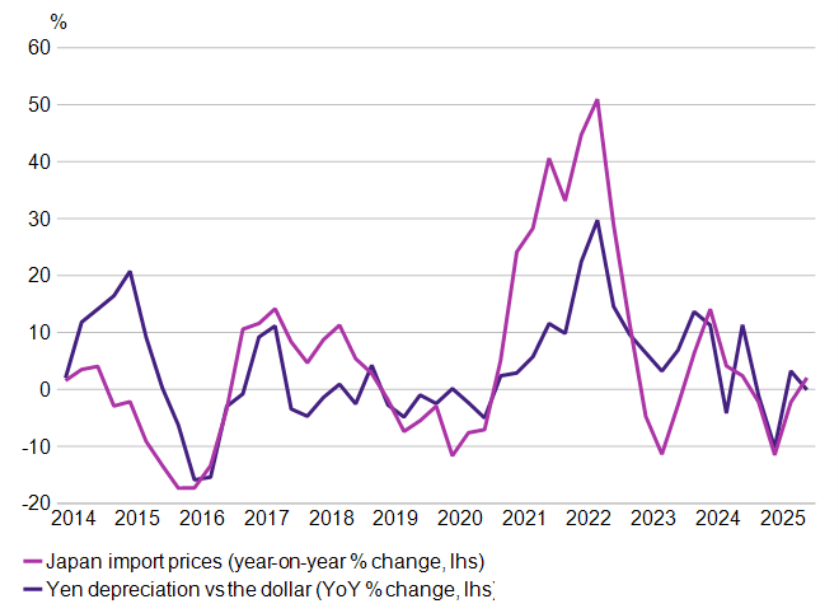
Chart 5: Yen’s depreciation vs the dollar and Japan import prices
Source: Amova AM, Macrobond, Japan Ministry of Finance (MOF)
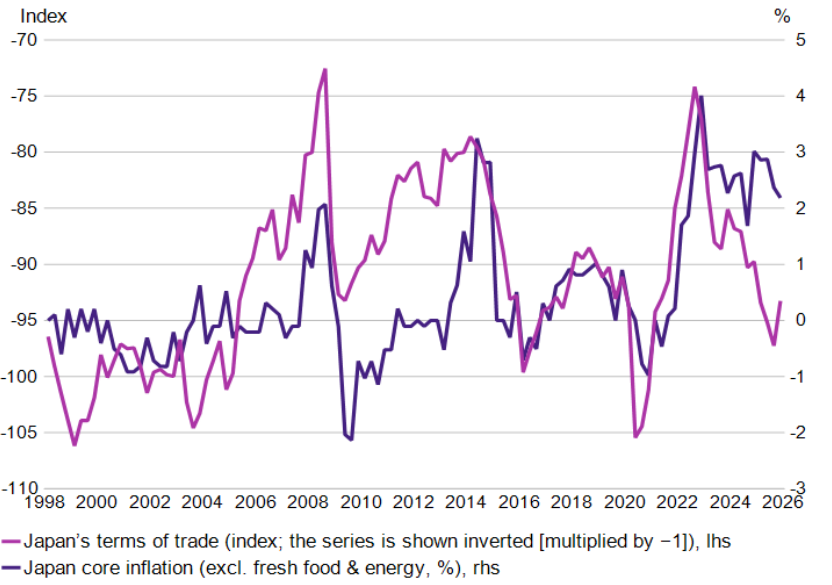
Chart 6: Japan terms of trade (inverted) and core CPI
Source: Amova AM, Japan Statistics Bureau, Ministry of Internal Affairs & Communications, MOF
Terms-of-trade deterioration
A terms-of-trade shock would be a likelier catalyst for weak growth than simply a rise in oil prices; this would mean import prices rise faster than export prices. This is where higher prices for the entire energy and logistics complex would feed directly into the economy. If the import price index began accelerating rapidly, terms of trade could deteriorate significantly unless export prices were adjusted accordingly. Meanwhile, in the presence of a large and persistent combined energy and logistics supply shock, any accompanying yen weakness, while helping export competitiveness, may—in practice—fail to provide the degree of support needed to prevent a slump in terms of trade. Conversely, yen depreciation would only aggravate the external income drain by making imports even more expensive.
Inflation channel
At this stage in the transmission process, the external shock is internalised. This means that the rise in imported energy prices—and possibly the decline in the yen—is not transitory and leads to expectations of pass-through into domestic consumer prices. Domestic prices would then rise in response to the terms-of-trade shock with a lag, potentially resetting the inflation anchor at a higher level.
We note that if yen weakness were to persist in tandem with elevated oil prices, pass-through could accelerate in comparison to a scenario driven by a rise in energy prices alone. In 2024, we had highlighted in The yen: how weak is too weak? the amplified role of currency weakness in transmitting cost pressures to consumer inflation in the post-pandemic environment. More recently, the BOJ emphasised in its January 2026 Outlook Report the role of foreign exchange in pushing up prices via import costs and corporate pass-through. In sum, Japan faces a significant probability of imported inflation pressures emerging with a lag.
BOJ policy constraints
If the above dynamics were to materialise, the BOJ could be forced to distinguish between a one-off imported cost shock and persistent price pressures that risks undermining its inflation-fighting credentials. If growth softens while inflation rises, the BOJ could face a classic stagflation-style policy trade-off. The mix of a weak yen and imported inflation described above could compel the BOJ to remove accommodation simply to retain its policy credibility, even in the absence of robust domestic demand. In such a scenario, the policy debate would shift from whether the central bank would opt to hike at all towards the extent to which the shock itself reduces policy freedom and poses a policy dilemma. Although tightening would risk worsening domestic weakness, failing to do so would risk exacerbating yen weakness and intensifying credibility questions. This could increase the risk of inflation expectations becoming unmoored to the upside.
Yen, JGB and equity effects
Effects on the yen
The currency effects could be observed throughout the transmission process, but they may become most crucial in response to policy action (or inaction). During commodity market stress, dollar/yen can rise rather than fall, reflecting expectations of heightened future demand for the US currency to pay for energy imports. At the same time, the markets may discount Japan’s sizeable current account surplus, temporarily undermining the yen’s status as a safe haven. Under such conditions, yen weakness may cease to be a benign tailwind for exporters and become a transition channel for imported inflation and policy stress.
JGB and equity implications
The Japanese government bond (JGB) market is where credibility spillovers may surface—specifically in the longer end of the yield curve. If fiscal subsidies are viewed as a source of long-term financing strain, this may compound unease that surging import costs and yen weakness leave the BOJ “behind the curve” in fighting inflation. While the JGB market may not be considered as disorderly despite recent gyrations in ultra-long-end yields, the signal value of longer-end yields bears watching.
In the Japanese equity market, greater bifurcation may emerge if the shock is constrained to energy commodities and does not cause a broader risk aversion. Energy, materials and financials could initially benefit from the combination of higher raw materials prices and ongoing risk appetite, even as the breadth of market performance may narrow. In such a scenario, index resilience could mask underlying domestic deterioration. A key risk is that, although exporters and commodity-linked sectors could initially act as an index buffer, a narrower growth base may render all firms vulnerable to the lagged effects of shocks to incomes and margins.
The possibility for a mid-cycle fork in the road: a tale of two regimes
Today’s received wisdom: low rates for longer equals weaker yen
Given the ongoing market response, the key risk scenario priced by the markets appears to be one in which the energy supply shock gives rise to global inflation, causing the Fed and the European Central Bank to be more restrictive for longer, while the BOJ remains cautious due to weak domestic demand. Interest rate differentials are therefore expected to widen and weaken the yen.
A viable alternative: BOJ acts to stem imported inflation
The path described above is not assured, however. A viable alternative is one in which Japan is hit by the external shock, leading to a sharp deterioration of its terms of trade. In this case, Japan’s greater imported energy dependency may cause inflation to rise faster than in the US and Europe—a scenario which would be aggravated by yen weakness, which would accelerate inflation pass-through. In this scenario, the BOJ would face heightened credibility pressure, and the cost of remaining on hold would outweigh the benefits of keeping policy accommodation in place. This scenario would imply faster normalisation, reduced tolerance for negative real interest rates and clearer communication on exchange rate pass-through—factors which were already mentioned in the BOJ’s January Outlook Report.
It is this latter scenario that the markets—particularly the forex market—may be overlooking. The forex market could therefore prove vulnerable to correction should the BOJ show resolve to resist credibility pressures related to the weak yen.
Conclusion
The effects of the Iran conflict may be less about oil prices than about the ability of global supply chains to function under stress. Logistics, insurance and volatility signals suggest that risks remain elevated even as oil prices retrace their earlier peaks.
For Japan, the shock created by the conflict is transmitted through terms of trade, inflation pass-through and BOJ policy credibility—channels that markets may still be underestimating. As the shock evolves, the key question is not whether the conflict will escalate further, but whether the physical and financial structure of global trade can normalise quickly enough to prevent a more persistent economic impact.